
Standard Deviation Calculator
Compute sample & population standard deviation, variance, mean, standard error, and sum of squares instantly with step-by-step formula math breakdown.
s = 0.00
0.00
0.00
0
0.00
0.00
0.00
0.00
0.00
0.00
0.00%
0.00
0.00
0.00
0.00
0.00
0.00
0.00
0.00
0.00
0.00
±0.00
| Index (i) | Value (xi) | Deviation (xi – x̄) | Squared Deviation (xi – x̄)2 |
|---|
What is Standard Deviation?
Standard deviation is a statistical measure that quantifies the amount of dispersion or variation in a set of data values. It tells you how spread out the numbers in a dataset are around the mean (average).
- Low Standard Deviation: Indicates that the data points tend to be close to the mean (very clustered, highly consistent).
- High Standard Deviation: Indicates that the data points are spread out over a wider range of values (more volatile, less consistent).
Sample vs. Population Standard Deviation
It is crucial to choose the correct type of standard deviation depending on where your data comes from:
1. Population Standard Deviation (σ): Used when your dataset represents the entire population (every member of the group you are studying). For example, the test scores of all students in a single classroom if you are only interested in that classroom. It divides by N.
2. Sample Standard Deviation (s): Used when your dataset is a sample representing a larger population. For example, a sample of 20 cars chosen to estimate the gas mileage of all cars of that model. It divides by N – 1 (Bessel’s correction) to correct for bias in estimating population variance.
Step-by-Step Calculation Formula
Calculating standard deviation involves these 6 steps:
1. Find the mean (average) of the dataset: add all values and divide by the count (N).
2. Calculate the deviation of each value from the mean: (x - mean).
3. Square each deviation to make it positive: (x - mean)².
4. Sum all the squared deviations. This value is called the Sum of Squares (SS).
5. Calculate the variance by dividing the Sum of Squares:
- By
Nfor Population Variance. - By
N - 1for Sample Variance.
6. Take the square root of the variance to get the Standard Deviation.
A standard deviation calculator is a simple yet powerful statistical tool that helps you measure how spread out a set of numbers is from its average value. Whether you are a student solving math assignments, a researcher analyzing data, or a professional working with statistics, this calculator provides quick and accurate results without the need for lengthy manual calculations.
Instead of spending time applying formulas by hand, you can enter your data into the calculator and instantly receive values such as the standard deviation, mean, variance, standard error, and other useful statistical measurements. This makes data analysis faster, easier, and more reliable.
This guide explains what standard deviation is, how the calculator works, the formulas behind it, practical examples, and why an online standard deviation calculator is useful for everyday statistical calculations.
What Is Standard Deviation?
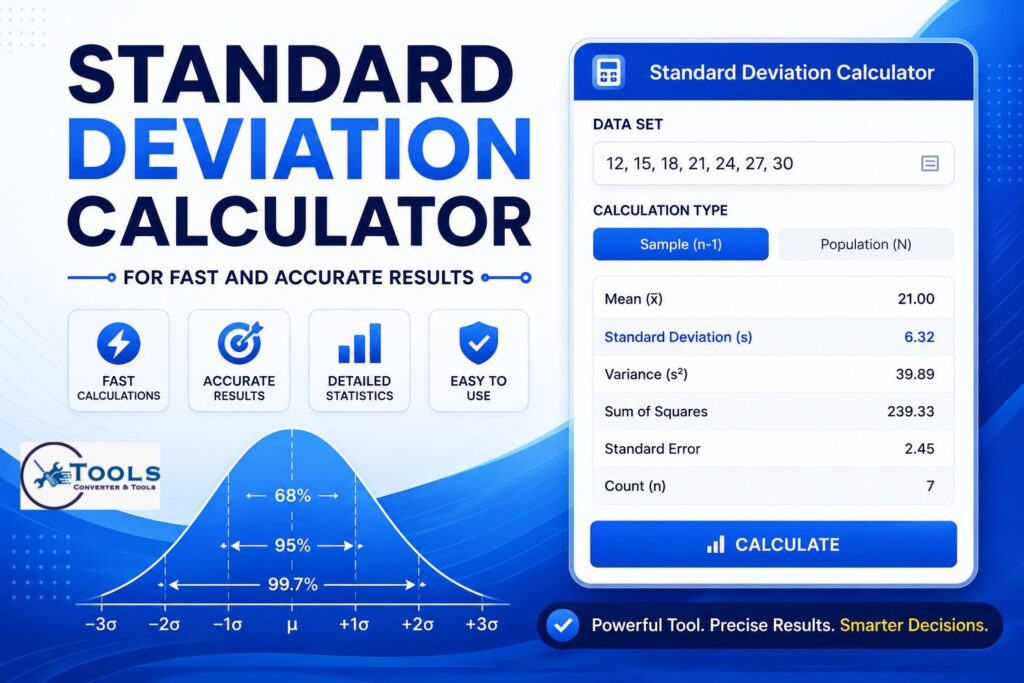
Standard deviation is a statistical measurement that shows how much the values in a dataset differ from the average (mean).
When the standard deviation is small, the data points are close to the average. When it is large, the values are spread farther away from the average.
Understanding standard deviation helps you evaluate the consistency and variation within a dataset.
Definition of Standard Deviation
Standard deviation measures the average distance between each data value and the mean. It provides a clear picture of how closely grouped or widely scattered the numbers are.
For example, if students receive nearly identical exam scores, the standard deviation will be low. If their scores vary greatly, the standard deviation will be much higher.
Why Standard Deviation Matters
Standard deviation is used in many fields because it helps people understand data more effectively. It can be used to:
- Measure consistency
- Compare different datasets
- Analyze financial risks
- Evaluate research results
- Monitor manufacturing quality
- Improve business decision-making
Sample vs. Population Standard Deviation
There are two common types of standard deviation.
Sample Standard Deviation
This is used when the data represents only part of a larger population. The calculation divides by n − 1, which provides a better estimate of the full population.
Population Standard Deviation
This is used when every value from the complete population is included. The calculation divides by n because the entire dataset is available.
Choosing the correct option ensures accurate results.
How to Use the Standard Deviation Calculator
Using the standard deviation calculator is straightforward.
Enter Your Data Values
Type or paste your numerical values into the input field. Most calculators accept numbers separated by commas, spaces, or new lines.
Example:
15, 18, 20, 22, 25
Choose Sample or Population Mode
Select the calculation type that matches your data.
- Choose Sample if your data is only part of a larger group.
- Choose Population if your data contains every value in the population.
Click Calculate
Press the Calculate button.
Within seconds, the calculator processes the numbers and displays all statistical results.
Review the Results
Depending on the calculator, you may receive:
- Standard deviation
- Mean
- Variance
- Sum of values
- Sum of squares
- Standard error
- Total number of observations
Many advanced calculators also display step-by-step calculations to help users understand how the result was obtained.
Standard Deviation Formula
The calculator performs the mathematical work automatically, but understanding the formulas helps explain how the results are produced.
Sample Standard Deviation Formula
For a sample dataset:
s = √[ Σ(x − x̄)² ÷ (n − 1) ]
Where:
- s = Sample standard deviation
- x = Individual value
- x̄ = Sample mean
- Σ = Sum of all values
- n = Number of observations
Population Standard Deviation Formula
For a complete population:
σ = √[ Σ(x − μ)² ÷ N ]
Where:
- σ = Population standard deviation
- μ = Population mean
- N = Total number of values
Explanation of Formula Components
Every calculation follows these steps:
- Find the average.
- Subtract the average from every value.
- Square each difference.
- Add all squared differences.
- Divide by the appropriate number.
- Take the square root.
The calculator performs all these calculations instantly.
How Standard Deviation Is Calculated
Understanding each calculation step helps users verify the results.
Calculate the Mean
The mean is calculated by adding every number and dividing by the total count.
Example:
Values:
10, 15, 20, 25
Mean:
(10 + 15 + 20 + 25) ÷ 4 = 17.5
Find the Difference from the Mean
Subtract the mean from every value.
Example:
10 − 17.5 = -7.5
15 − 17.5 = -2.5
20 − 17.5 = 2.5
25 − 17.5 = 7.5
Square Each Difference
Squaring removes negative values.
Examples:
-7.5² = 56.25
-2.5² = 6.25
2.5² = 6.25
7.5² = 56.25
Calculate the Variance
Add all squared differences and divide according to the selected calculation type.
Find the Standard Deviation
Finally, take the square root of the variance.
The standard deviation calculator completes all these steps in a fraction of a second.
Example Calculations
Examples make the process easier to understand.
Example of Sample Standard Deviation
Dataset:
8, 10, 12, 15, 20
The calculator determines:
- Mean
- Sample variance
- Sample standard deviation
Since this is only a sample, the calculation uses n − 1.
Example of Population Standard Deviation
Dataset:
50, 55, 60, 65, 70
Because every value in the population is included, the calculator uses N rather than n − 1.
Understanding the Results
Suppose the calculator returns:
- Mean: 60
- Standard deviation: 6.32
This means most values are approximately 6.32 units away from the average.
A smaller value indicates more consistent data.
A larger value indicates greater variation.
Features of This Standard Deviation Calculator
A modern standard deviation calculator offers several useful features.
Supports Sample and Population Data
Users can switch between both calculation methods with a single click.
Instant and Accurate Results
Results are generated almost immediately after entering the data.
Step-by-Step Calculations
Many calculators display each mathematical step, making learning easier for students.
Works on Desktop and Mobile
The calculator is responsive and can be used on computers, tablets, and smartphones.
Easy-to-Use Interface
A clean design makes calculations simple, even for beginners.
Understanding the Results
The calculator provides several statistical values besides standard deviation.
Mean
The average value of the dataset.
Variance
Variance measures the average squared difference from the mean.
Standard Deviation
The square root of the variance.
It shows how spread out the data is.
Standard Error
Standard error estimates how accurately the sample mean represents the population mean.
Sum of Squares
This value represents the total squared distance between every observation and the mean.
It is commonly used in statistical analysis and research.
Common Uses of Standard Deviation
Standard deviation is widely used in many industries.
Education and Statistics
Students use it to solve assignments, understand statistical concepts, and analyze exam results.
Business and Finance
Businesses analyze sales, customer behavior, and financial performance.
Investors use standard deviation to estimate investment risk.
Scientific Research
Researchers compare experimental results and evaluate data consistency.
Quality Control
Manufacturers monitor product quality and production accuracy using statistical variation.
Data Analysis
Data analysts rely on standard deviation to identify trends, detect outliers, and evaluate performance.
Tips for Accurate Calculations
Following a few simple practices helps produce reliable results.
Use Correct Data Values
Double-check every number before calculating.
Select the Right Calculation Type
Choose Sample or Population depending on your dataset.
Check Your Input Before Calculating
Remove duplicate entries or typing mistakes to avoid incorrect results.
Advantages of Using an Online Standard Deviation Calculator
Online statistical tools provide several benefits.
Saves Time
Complex calculations are completed instantly.
Reduces Manual Errors
Automatic calculations eliminate common arithmetic mistakes.
Suitable for Beginners and Professionals
Whether you are learning statistics or conducting professional research, the calculator is easy to use and highly reliable.
Work Time Calculator for Daily and Weekly Hours
Frequently Asked Questions
What is a standard deviation calculator?
A standard deviation calculator is an online statistical tool that calculates the standard deviation, mean, variance, and other related values from a dataset.
What is the difference between sample and population standard deviation?
Sample standard deviation is used when analyzing part of a population, while population standard deviation is used when every value in the population is included.
Can I calculate standard deviation for multiple values?
Yes. Simply enter all numerical values into the calculator, and it will process the complete dataset automatically.
Does this calculator show calculation steps?
Many advanced calculators display detailed calculation steps, formulas, and intermediate results to help users understand the process.
Is this standard deviation calculator free to use?
Yes. Most online standard deviation calculators are free and can be used as often as needed without registration.
Conclusion
A standard deviation calculator is an essential tool for anyone working with numerical data. It simplifies complex statistical calculations by automatically computing the standard deviation, mean, variance, standard error, and other important measurements within seconds.
Whether you are a student studying statistics, a researcher analyzing experiments, a business professional reviewing performance, or a financial analyst evaluating risk, this calculator provides accurate and reliable results while saving valuable time. By selecting the correct calculation type and entering your data carefully, you can quickly gain meaningful insights into the variation and consistency of any dataset.
